
Dashboards are pre-built visualizations that Libib provides in order for you to see stats about your libraries.
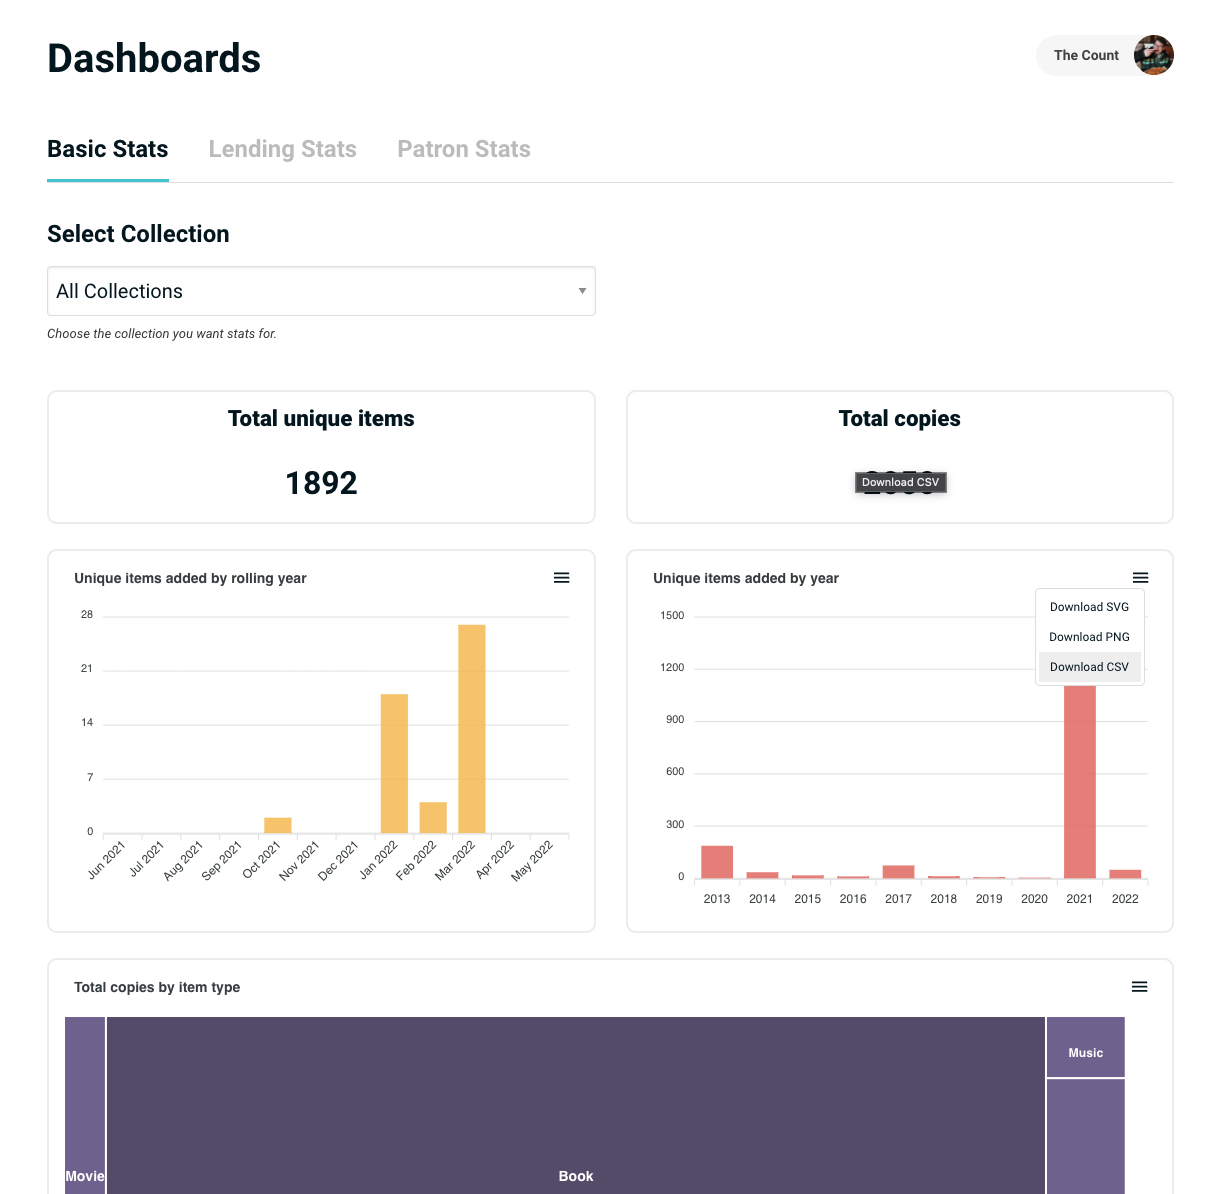
- Total unique items
- Total copies
- Unique items added by rolling year
- Unique items added by year
- Total copies by item type
- Pricing summary for all items by collection
Pro users get additional dashboards for Lending and Patron stats.
- Number of items checked out, checked in or placed on hold within a rolling year
- Number of items checked out, checked in or placed on hold each year (5 years worth of data)
- Patrons created and active within a rolling year
- Patrons created by year (5 years worth of data)
- Patrons active by year (5 years worth of data)
- 10 most active patrons of the current year (number of check outs)
- 10 most active patrons ever (number of check outs)